How To Use This App
Purpose: Since weather conditions have such a tremendous impact on climbing performance, the goal for this application is to create a standardized score that can be used as a quick reference to assist in determining how the current and forecasted weather will affect climbing ability. Secondary goals are to assist in understanding the differences that exist between climbers, and also to help each individual climber understand how conditions affect their personal performance.
To use this app, simply select the desired location from the drop-down menu in the climbing conditions widget in the left sidebar, then click the Get Climbing Conditions button. A quick reference widget is also displayed in the side bar that displays the current conditions (default Red River Gorge).
A chart will be shown in the main area to the right of the sidebar. The generated chart will display the 5-day forecasted climbing conditions score (CCS) for the selected destination.
Note: Optimal conditions vary from climber to climber, so determining the CCS you perform the best at may be a learning experience.
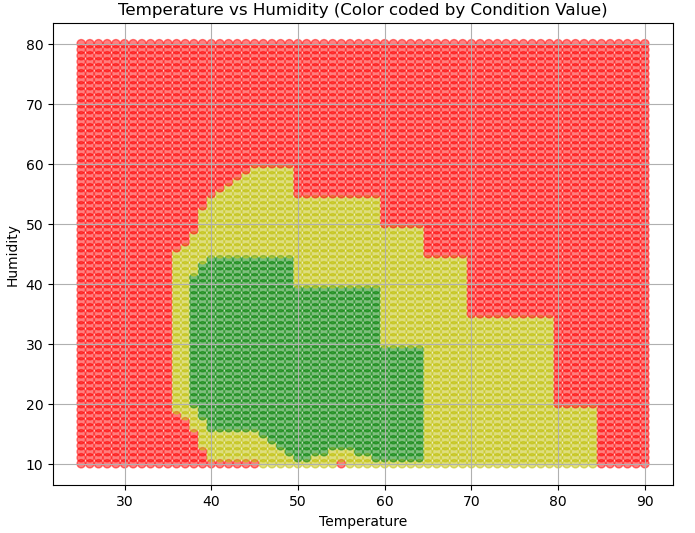
How to read and use the chart:
The chart is broken into 3-hour sections, where each section will have the following properties:
- Red indicates poor conditions.
- Yellow indicates good conditions.
- Green indicates optimal conditions (better take off work)
* Again, these colors are created based on the average climber, your personal experience may be slightly or significantly different.
- If a vertical shaded bar is present, then that signifies the section is representing nighttime hours.
- If a vertical shaded bar is absent, then the section represents daytime hours.
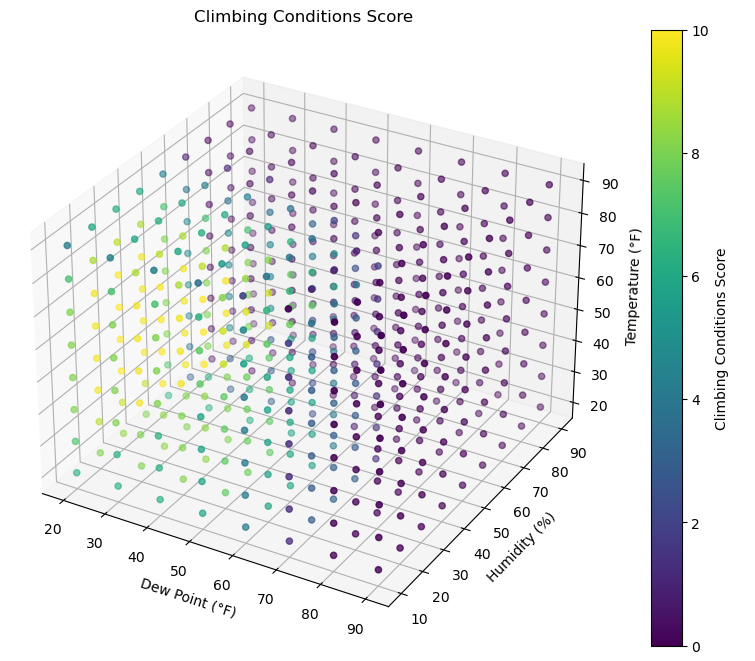
- Each datapoint represents the CCS for the day and time listed on the x-axis.
- To get more information, hover or tap the datapoint to display the forecasted CCS, Temperature, Humidity, and Dew Point.
- If the datapoint is red then there will likely be condensation on the rock and the climbing conditions will be very bad.
- A weather icon will be displayed in the x-axis label, along with the Day and Time (EST-12hr). The icon will give the forecasted conditions, sunny, partially cloudy, full cloud cover, rain, or snow. Note: The sun icon at night just means a clear night, so read the icons accordingly.
If viewing the application on a mobile device the chart can be best viewed by clicking the Fullscreen button then rotating your screen to the horizontal position.
The chart also contains numerous functions to that can assist in a better viewing experience.